Last month we launched our new Agile Maturity Index (AMI) and kicked off our five part series by focussing on the first of the five macro attributes, High Performing Teams, that can be continually monitored by running the AMI on the new Temporall Workbench platform.
Running a large agile engineering function requires the right levels of process and governance to support those high performing teams. So, the second blog in our series will focus on the key data and insights that we can draw from the AMI around your teams’ confidence in this area.
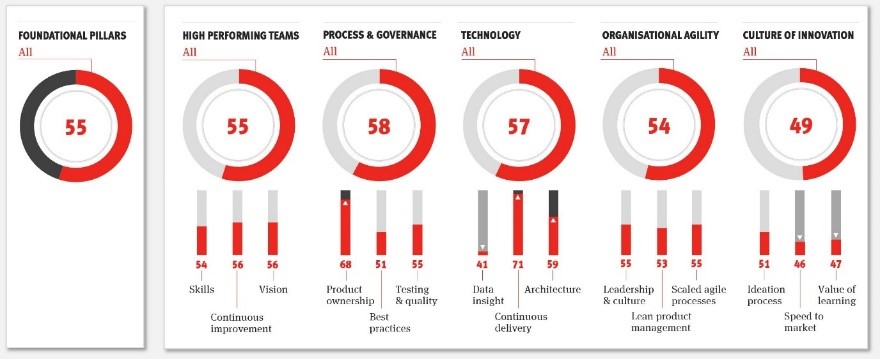
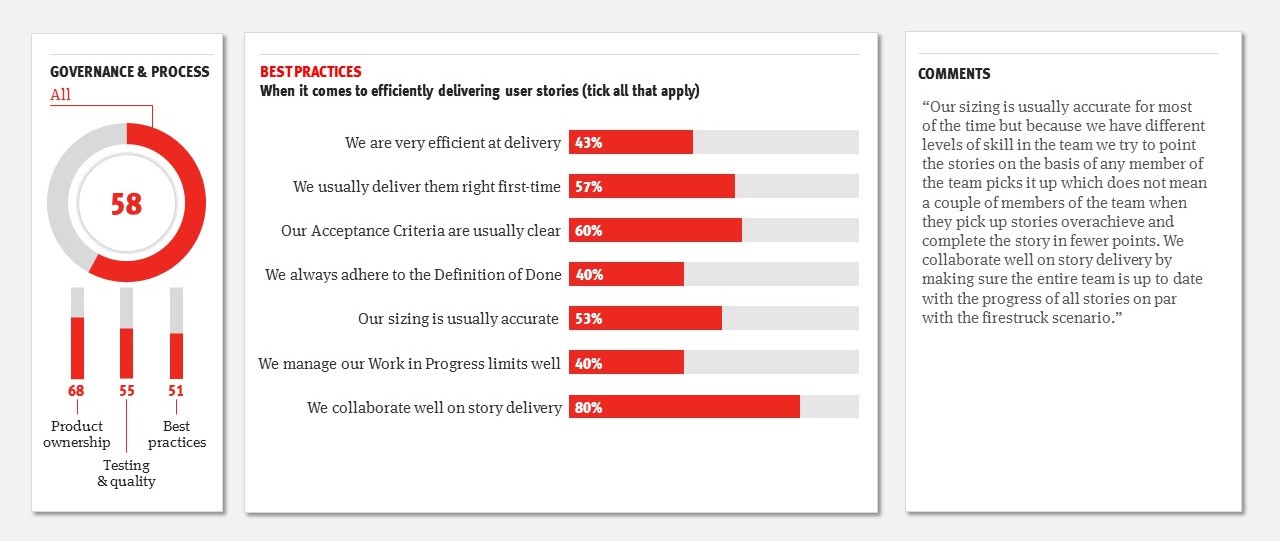
From our high-level quantitative data, we can see that the teams have strong confidence in their Product Owners. In fact, it is the highest scoring micro attribute, although what will be more important is to show a positive trend in this area over time. Best Practices and Test & Quality are scoring less well but at this high level it is important to review the data more closely in order to draw effective insight.
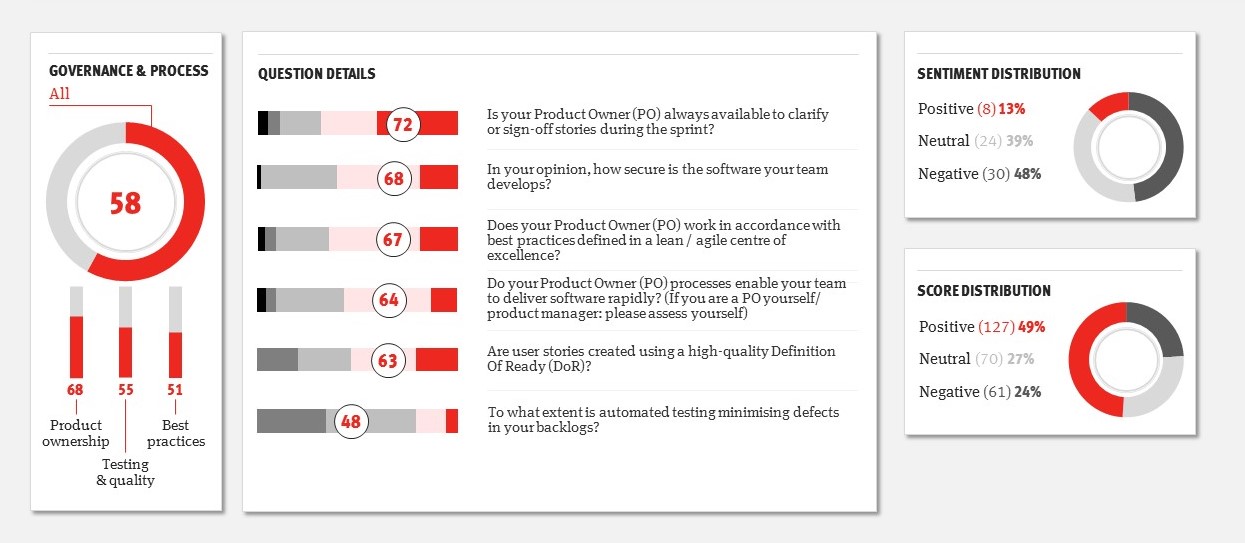
Drilling in further shows us that whilst the teams have good confidence in their Product Owners, Security and other Best Practices (there is a spread in the answers so some learning across teams and improvement is no doubt possible for next time) there is a concern around the effectiveness of automated testing in reducing defects from the product backlog.
As with all macro and micro attributes, we can also see the sentiment towards this attribute based on analysis of the comments (the top right of the image above). As with the High Performing Teams we can see this is more negative than the quantitative scores (which is not unusual) and again, what is important is that the platform will let us see this trending upwards as the teams become happier with the improvements we are making.
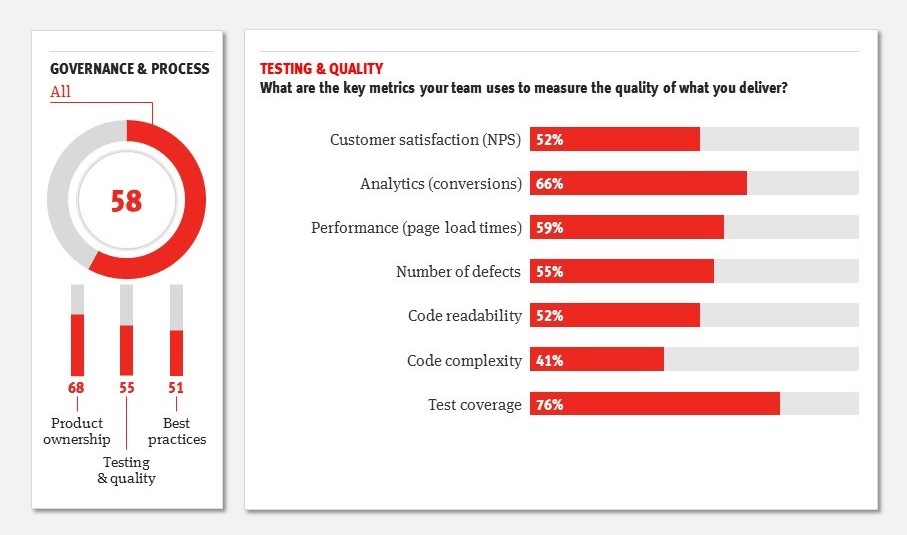
Looking deeper again into some of the specific questions, what’s interesting here is that the teams are flagging that Test Coverage is a key metric for measuring the quality of the work across the programme (and we can actually see that the team has good coverage via their automated reports from Azure DevOps). However, this KPI appears to be a bit of a vanity metric since we saw earlier that the code coverage isn’t doing a good job at minimising defects. So, the team needs to look at the overall quality of those automated tests to understand why.
There are lots more insights that we would drill into further in a full report. For example, looking at whether code complexity could or should be better measured by the teams (are they building up technical debt here?).
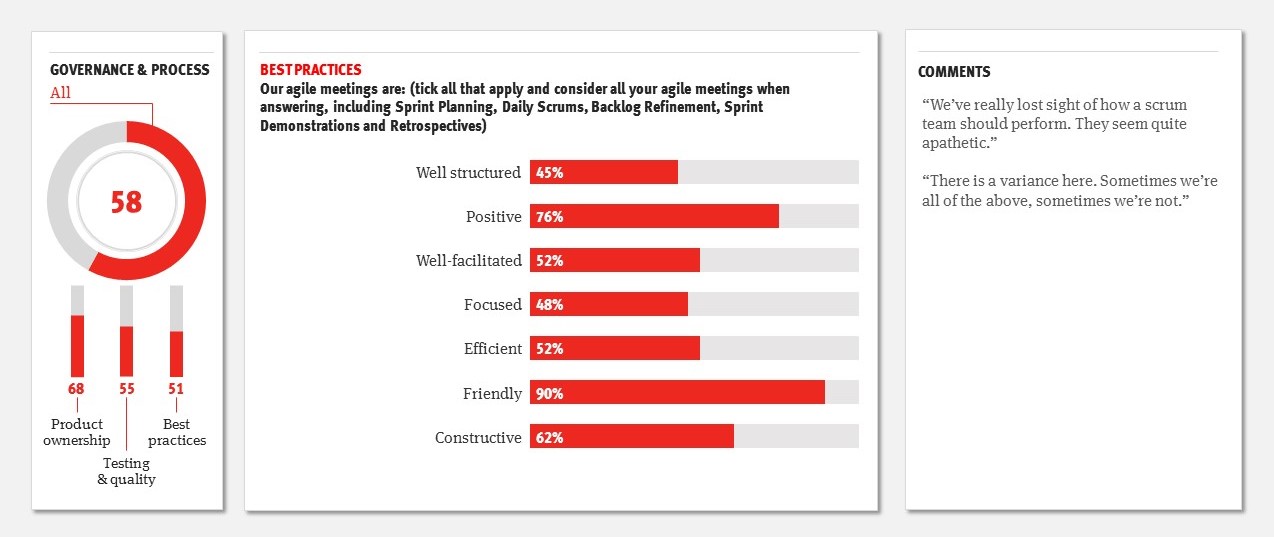
And drilling into a specific question on the quality of the agile meetings (see below) highlights that whilst they seem to be “friendly” and “positive” they are scoring lower for areas such as efficiency and focus, and further analysis of the comments shows some frustrations that should be addressed:
There were also some quick wins from analysing a detailed question on the delivery of user stories. The teams flagged that whilst collaboration was good (although we know from our High Performing Teams macro attribute that there are frustrations around cross-functional capabilities) the teams did not feel efficient at user story delivery and had poor management of critical work in progress (WIP) limits during the sprints. Again, this will be a key area of focus for the following few months:
All of the data at any level can then also be analysed based on a number of different filters. For example, how does the scoring and sentiment vary between teams, roles or physical locations? Below we can see that there are differences at a high level between the teams who are connected with the London office versus those connected with the Midlands office:
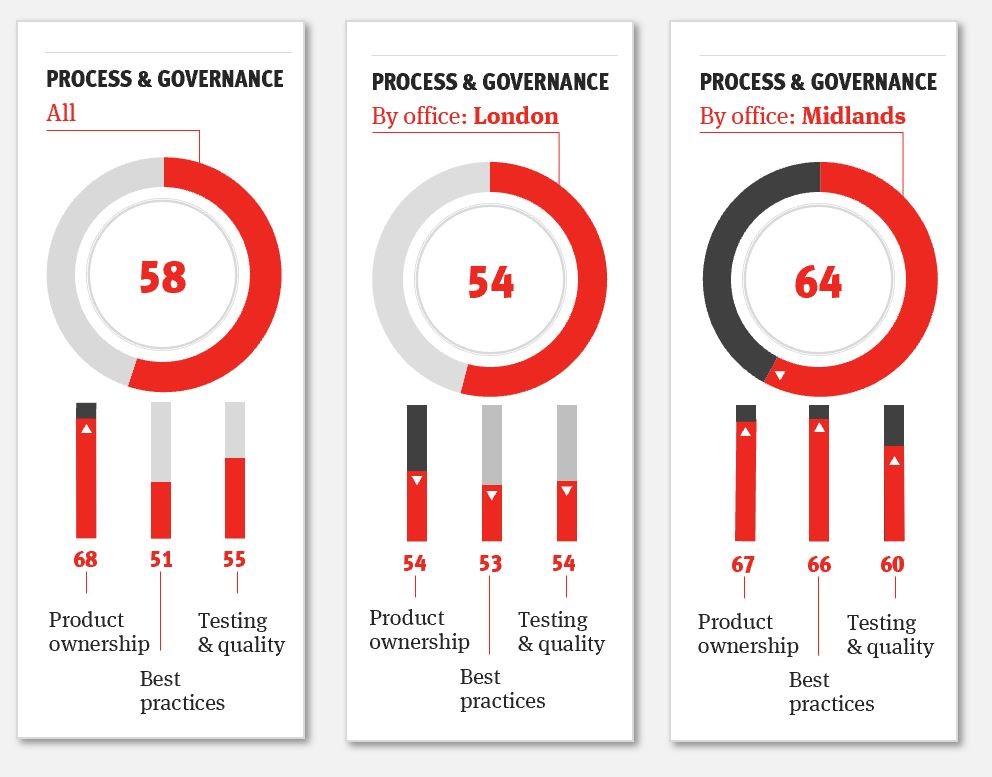
We would certainly want to look at the difference of opinion around the quality of Product Ownership between the two physical locations to see if there are learnings from one that will provide insight in how to improve this in the other location.
As you can see, with just a brief skim over some of the outputs and the filtering available there is an enormous richness to the data provided in just this one macro attribute. The insights gained here will shape the strategies to focus on for the next quarter, before being able to measurably demonstrate improvements in both performance and sentiment. Happy teams who are improving will reduce churn in your engineering team as well as improve the efficacy of output.
The third blog in the five-part series will focus on the Technology macro attribute which demonstrates how well the teams understand the architectural vision, their continuous delivery capability and the use of data insights to drive the backlogs.
In the meantime, if you’d like a demo or more information on how you can use the Agile Maturity Index to measurably improve your agile transformation, please drop me an email at james.c@mmtdigital.co.uk.

